

Swift Regex Deep Dive
iOS MacOur introductory guide to Swift Regex. Learn regular expressions in Swift including RegexBuilder examples and strongly-typed captures.
The other day I was chatting with one of my colleagues at the Ranch and he asked me where I get my blog ideas. One fertile idea-ground is what sometimes happens during day-to-day work, solving a potentially hard problem in a way that’s actually pretty easy. And then I discover there’s a fair amount of ground work needed to understand it. Hence these multi-part War and Peace epics.
The objc provider in DTrace is the ultimate goal. But to understand the objc provider, you need to grok the basics of DTrace. You also need to know how DTrace traces functions inside of a particular process. The pid provider does this, and happily the objc provider works in a similar manner.
The pid provider lets you trace functions inside of a particular process. The name comes from Unix parlance, where pid means “process ID”. getpid() is the system call to get your process ID.
The syscall provider you saw last time lets you monitor system calls across the entire machine, and you can use predicates to limit the view to just one process. The syscall provider doesn’t let you trace things that live in libraries, like malloc(). The pid provider exposes all of the available functions and data types for single. particular process. Want to see how Safari uses malloc? You can ask the pid provider.
A probe description for the pid provider follows the same provider:module:function:name pattern :
pid3321:libsystem_c.dylib:malloc:entry
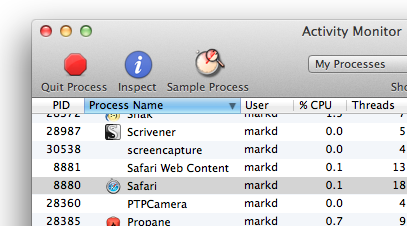
This says, for process id 3321, in libsystem_c.dylib, the malloc function, whenever it enters, go do stuff. For fun, see what Safari is doing. Figure out Safari’s process ID. An easy way to do that is to peek in Activity Monitor:
You can also ps and grep to get it from the command-line:
$ ps auxw | grep Safari
And then construct a command putting the process ID after “pid”
# dtrace -n 'pid8880::malloc:entry { printf ("Safari asking for %d bytes", arg0); }'
dtrace: description 'pid8880::malloc:entry ' matched 2 probes
CPU     ID                    FUNCTION:NAME
 2   3756                     malloc:entry Safari asking for 24 bytes
 2   3756                     malloc:entry Safari asking for 24 bytes
 1   3756                     malloc:entry Safari asking for 98304 bytes
 2   3756                     malloc:entry Safari asking for 4 bytes
 0   3756                     malloc:entry Safari asking for 8 bytes
 1   3756                     malloc:entry Safari asking for 98304 bytes
 2   3756                     malloc:entry Safari asking for 4 bytes
 2   3756                     malloc:entry Safari asking for 8 bytes
Sure enough, we’ve got code running for each call to malloc. Everything else you know about DTrace applies now. The pid provider is just another provider that you can hang other code off of.
Before getting into some more interesting stuff about the pid provider, there’s an elephant in the room. That process ID. The pid provider needs to know what process to introspect, and you do that by providing the numerical process ID.
That’s a pain in the neck. There’s three things that you can do.
The first thing you can do is to just paste the process ID in your command. It’s up to you to figure out the process ID of interest. That’s fine for one-off commands, and is how I sometimes roll.
The second option is to use a variable, like $1, for the process ID, and then pass the process ID on the command line:
# dtrace -l -n 'pid$1::malloc:entry' 8880
   ID   PROVIDER            MODULE                          FUNCTION NAME
 3756   pid8880  libsystem_c.dylib                            malloc entry
 6204   pid8880               dyld                            malloc entry
That way you don’t need to retype the whole command or edit a chunk in the middle. This is especially useful for scripts that live in files. Refer to the process ID via $1 and you can use that script against any process.
These dollar-variables are generic. You can pass multiple extra parameters to dtrace and they’ll be available as $1, $2, etc. You might have a threshold you want to change from run to run, like only report functions that try to malloc more than 4 megs at a time.
The third option is to let DTrace run the program for you, with the -c option. You give dtrace -c and a path to a program. dtrace will run the program and start its tracing. When the program exits, the tracing finishes. That’s how I usually run DTrace experiments these days – trace some stuff in an application, and then exit while I go analyze the results.
The big advantage to running with -c is easy access to the process ID : just use the $target variable.
Here’s a simple C program:
#include <stdio.h>
// clang -g -Weverything -o simple simple.c
int main (void) {
    printf ("I seem to be a verbn");
    return 0;
} // main
All it does is print out a line. I wonder if this calls malloc as part of its work. Let’s see:
# dtrace -n 'pid$target::malloc:entry' -c ./simple
dtrace: description 'pid$target::malloc:entry' matched 2 probes
I seem to be a verb
dtrace: pid 11213 has exited
CPU     ID                    FUNCTION:NAME
 10   7518                     malloc:entry
Sure enough, it was called once. I wonder where. There’s a built-in action called ustack which gives you the stack trace in user-land:
# dtrace -n 'pid$target::malloc:entry { ustack(); }' -c ./simple
dtrace: description 'pid$target::malloc:entry ' matched 2 probes
I seem to be a verb
dtrace: pid 11224 has exited
CPU     ID                    FUNCTION:NAME
 12   9817                     malloc:entry
              libsystem_c.dylib`malloc
              libsystem_c.dylib`__smakebuf+0x7f
              libsystem_c.dylib`__swsetup+0x99
              libsystem_c.dylib`__vfprintf+0x61
              libsystem_c.dylib`vfprintf_l+0x2d7
              libsystem_c.dylib`printf+0xc8
              simple`main+0x1d
              libdyld.dylib`start
              simple`0x1
So, printf called vprintf called __vfprintf, into something called __swsetup, which makes a buffer, which then calls malloc. Pretty neat. You can pass an argument to ustack to only print out the top N functions of the stack trace if you don’t care about its ancestry all the way back to before main.
One of the nice things about -c is that your script ends when the program exits. Otherwise dtrace will run forever, until the script itself decides to bail out with the exit() action, dtrace gets interrupted by Control-C, or something catastrophic happens like the user logging out, the system rebooting, or the heat death of the universe arrives.
What are some of the probes you look at with the pid provider? You can take a look! The simple program from above is pretty basic, so take a look at that. Recall that -l (dash-ell) will list probes, and -n lets you provide a probe description. If you use -c (run a program) and -l, dtrace will forgo actually running the program, and just emit the list of probes. Try this:
# dtrace -l -n 'pid$target:::entry' -c ./simple > simple-probes.txt
Be sure you have entry at the end. You’ll see why in a bit. Poke around simple-probes.txt in your favorite editor. You’ll see calls provided by libcache.dylib, libSystem.B.dylib, common crypto, grand central dispatch, and all sorts of other goodies. In fact, on my system, I have over fourteen thousand of them:
# dtrace -l -n 'pid$target:::entry' -c ./simple | wc -l
   14256
You’re not limited to your own programs. You can look at system utilities:
# dtrace -l -n 'pid$target:::entry' -c /bin/ls > ls-probes.txt
You can also look at Cocoa programs. Just dig into the bundle to find the executable
# dtrace -l -n 'pid$target:::entry' -c /Applications/TextEdit.app/Contents/MacOS/TextEdit > textedit-probes.txt
Here’s a smattering:
204547   pid11399    CoreFoundation                 CFMachPortGetPort entry
204548   pid11399    CoreFoundation              CFDictionaryGetValue entry
204549   pid11399    CoreFoundation             CFBasicHashFindBucket entry
204550   pid11399    CoreFoundation     __CFDictionaryStandardHashKey entry
204551   pid11399    CoreFoundation         CFBasicHashGetSpecialBits entry
204552   pid11399    CoreFoundation              __CFRunLoopDoSource1 entry
204553   pid11399    CoreFoundation                          CFRetain entry
...
311688   pid11399   libxml2.2.dylib           _xmlSchemaParseTimeZone entry
311689   pid11399   libxml2.2.dylib             _xmlSchemaParseGMonth entry
311690   pid11399   libxml2.2.dylib               _xmlSchemaParseTime entry
311691   pid11399   libxml2.2.dylib                        xmlStrndup entry
...
312236   pid11399      libz.1.dylib                         compress2 entry
312237   pid11399      libz.1.dylib                          compress entry
312238   pid11399      libz.1.dylib                     compressBound entry
312239   pid11399      libz.1.dylib                     get_crc_table entry
...
364759   pid11399      CoreGraphics           _CGSReleaseColorProfile entry
364760   pid11399      CoreGraphics      _CGSUnlockWindowBackingStore entry
364761   pid11399      CoreGraphics                 CGSGetWindowLevel entry
364762   pid11399      CoreGraphics             CGWindowContextCreate entry
364763   pid11399      CoreGraphics                   CGContextCreate entry
364764   pid11399      CoreGraphics       CGContextCreateWithDelegate entry
364765   pid11399      CoreGraphics            CGRenderingStateCreate entry
...
Want to trace stuff in CoreFoundation or CoreGraphics? Go right ahead. Want to see if your program is compressing anything with libz? Be my guest.
If you look closely at this set of probes (search for “AppKit” or “Foundation”) you’ll see some Objective-C stuff, so you can run some experiments with just the pid provider. But it’s kind of awkward.
Recall that the last chunklet of the probe description is called the name. That’s a pretty vague term. The pid provider has three kinds of names. entry, return, and a number.
When you specify entry, your DTrace clause will start processing right before the specified function starts running. You can look at arguments passed to the the function with the built in variables arg0, arg1, and so on.
When you specify return, your DTrace clause will start processing right after the function returns. arg1 contains the return value from the function. arg0 contains the instruction offset from the beginning of the function where the return happened. That’s pretty cool – inside of your DTrace script, you could (depending on your understanding of the function in question) determine when the function bailed out early, or finished to completion. Or you could tell when a function returned normally, and when it returned in an error path. You can answer questions like “what is the percentage of early bailouts for this function?”
So that number you could provide as a name for a pid provider probe? It’s an offset into the function. That means you can have your DTrace stuff trigger at an arbitrary point inside of the function.
This means that each instruction is a potential dtrace probe. Earlier where I said to be sure to use entry in the probe description? What happens if you forget it? The dtrace command will take a long time to run. And then you’ll have a whole lot more probes. Here’s simple, looking at entry probes:
# dtrace -l -n 'pid$target:::entry' -c /bin/ls | wc -l
   14851
And here it is without:
# dtrace -l -n 'pid$target:::' -c ./simple | wc -l
  667217
Atsa lotsa probes.
So what’s the takeaway from the pid provider?
You can trace functions inside of a single process
You can explore the exported symbols of a program (this can be interesting / educational in its own right)
entry lets you look at function arguments; return lets you look at the return value (arg1) and return instruction (arg0)
You can trace at a granularity of individual instructions
You need to provide the process ID, either explicitly in the probe description, via an argument to dtrace and accessed with $1, or use $target and run dtrace with -c and supplying the path to an executable
DTrace becomes a lot more interesting when you can play with variables. Variables in DTrace can be used undeclared. You can also declare them, and their type is set on their first assignment. You can’t declare and assign at the same time. You can have variables of just about any C type, like ints, pointers, arrays and even structures. If you have a pointer to a structure, you can dig into it. The main limitation is no floating point variables.
DTrace has three scopes for variables. Variables are global by default.
Here is a way of figuring out how long a function took to run, using the built-in timestamp variable, which is a wall-clock timestamp, in nanoseconds. (There’s also vtimestamp, which is an on-cpu-time timestamp, also in nanoseconds):
/* run with
 * dtrace -s malloctime.d -c ./simple
 */
pid$target::malloc:entry
{
    entry_time = timestamp;
}
pid$target::malloc:return
{
    delta_time = timestamp - entry_time;
    printf ("the call to malloc took %d ns", delta_time);
}
When malloc is entered, the timestamp is stored in the global variable entry_time. When malloc exits, the stashed value is subtracted from the current timestamp, and printed. You’d run it like this:
# dtrace -s malloctime.d -c ./simple
dtrace: script 'malloctime.d' matched 4 probes
I seem to be a verb
dtrace: pid 12006 has exited
CPU     ID                FUNCTION:NAME
  6  57313                malloc:return the call to malloc took 15066 ns
We live in a multithreaded world, so using a global for storing the start timestamp is not a great idea. DTrace has two additional variable scopes: clause-local and thread-local.
“Clause-local variables” are just a fancy name for local variables. They’re decorated with this-> in front of the variable name, come into being inside of the actions block, and are discarded when the actions block ends. delta_time above would become this->delta_time:
This makes the delta variable safer because there is no chance another threads could change its value:
pid$target::malloc:entry
{
    entry_time = timestamp;
}
pid$target::malloc:return
{
    this->delta_time = timestamp - entry_time;
    printf ("the call to malloc took %d ns", this->delta_time);
}
There’s still a problem with this, though, in a full-on multithreaded program. Thread A might enter malloc, and record the timestamp. Thread B then enters malloc and records its timestamp, clobbering the previous value. When Thread A finally returns, the reported time will be too short. Bad data could lead to bad decisions.
In DTrace, “Thread-local Variables” are prefixed with self->, and are (as the name implies) kept on a per-thread basis. To fix the bad malloc-time problem, you’d store the timestamp in a thread local variable on entry, pull it out on return, and do your math. Because thread local variables need to stick around, you should “collect” them when you are finished with them by assigning them to zero. Here’s the updated version:
pid$target::malloc:entry
{
    self->entry_time = timestamp;
}
pid$target::malloc:return
{
    this->delta_time = timestamp - self->entry_time;
    printf ("the call to malloc took %d ns", this->delta_time);
    self->entry_time = 0;
}
D is indeed a real programming language, because there’s always something that needs fixing in the code you write. There’s still one problem with this. What happens if you start tracing the program while malloc is already in flight? The return probe will fire, the timestamp calculation reaches for self->entry_time, and there’s nothing there. Its value will be zero, leading to delta_time becoming timestamp - 0, which will be a humongous value. You’ll need something to prevent the return probe from running when there’s no entry_time.
Predicates to the rescue! Add a predicate to skip the return probe’s action body if the entry_time thread-local variable has not been set:
pid$target::malloc:entry
{
    self->entry_time = timestamp;
}
pid$target::malloc:return
/self->entry_time/
{
    this->delta_time = timestamp - self->entry_time;
    printf ("the call to malloc took %d ns", this->delta_time);
    self->entry_time = 0;
}
Of course, this isn’t a problem with simple, but can bite you when you’re doing Real Investigations.
You can see all of the functions called by a program:
# dtrace -n 'pid$target:::entry' -c /bin/echo
You can see there’s a lot of work involved in just getting a program up and running.
See the different modules available in a program (thanks to rancher Bill Phillips for the processing pipeline)
# dtrace -l -n 'pid$target:::entry' -c ./simple | awk '{print $3}' | sort | uniq
Dtrace has “associative arrays”, which act like dictionaries or hashes in other languages. They look like regular variables, indexed with square brackets. You can use any value (and any combination of values) as a key. You can make a cheap time profiler by storing the start times for functions in an associative array:
/* run with
 * dtrace -q -s malloctime.d -c ./simple
 */
pid$target:::entry
{
    entry_times[probefunc] = timestamp;
}
pid$target:::return
/entry_times[probefunc]/
{
    this->delta_time = timestamp - entry_times[probefunc];
    printf ("the call to %s took %d nsn", probefunc, this->delta_time);
    entry_times[probefunc] = 0;
}
Add the -q flag when running it to suppress dtrace’s automatic display, which makes the output hard to read. But here’s a sample from the middle of the run:
# dtrace -q -s ./call-timings.d -c ./simple
...
the call to __swsetup took 255014 ns
the call to __get_current_monetary_locale took 14135 ns
the call to __get_current_numeric_locale took 13170 ns
the call to localeconv_l took 67980 ns
the call to memchr took 5461 ns
the call to memmove$VARIANT$sse42 took 11023 ns
the call to __fflush took 5440 ns
the call to __swrite took 5571 ns
the call to __write_nocancel took 19920 ns
the call to _swrite took 47466 ns
the call to __sflush took 59219 ns
the call to __sfvwrite took 119338 ns
the call to vfprintf_l took 483334 ns
the call to printf took 517681 ns
...
Run this and send the output to a file, and browse around. You should find where main ends, and then all the process tear-down happens. Run it against your own programs.
Next time features the objc provider, which is a lot like the pid provider, but gives first-class access to Objective-C land.
Our introductory guide to Swift Regex. Learn regular expressions in Swift including RegexBuilder examples and strongly-typed captures.
The Combine framework in Swift is a powerful declarative API for the asynchronous processing of values over time. It takes full advantage of Swift...
SwiftUI has changed a great many things about how developers create applications for iOS, and not just in the way we lay out our...