

Swift Regex Deep Dive
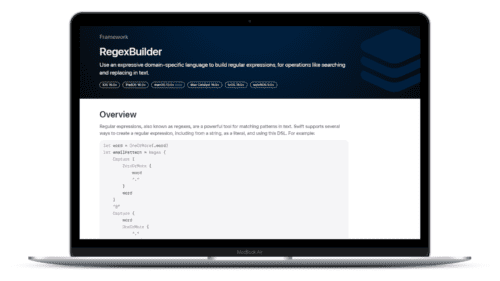
iOS MacOur introductory guide to Swift Regex. Learn regular expressions in Swift including RegexBuilder examples and strongly-typed captures.
One of Xcode 7’s new features is in-line display of code coverage metrics.
Yay? That’s a pretty dull way of describing a nice feature. Code coverage
figures out which lines of code have been executed while running unit tests,
and now Xcode shows you information about this coverage in the UI.

Lines of code that were run during the test are displayed normally. Lines of
code that never got run are given a shaded background. The gutter on the
right-hand side of the source editor shows how many times that particular line
of code was run during the test.
The figure above is a compare: method that was called 29 times during the test. Notice that lines 132-135 are partially in gray. Those are lines of code that weren’t touched by the test. You can see the rank1 < rank2 and rank1 > rank2 comparisons were hit (four times each) so they’re not shaded, but the NSOrderedAscending/Descending branches were never reached. If I want to increase my coverage, I would need to make sure that the “typeRanks” have differing values.
Enabling Xcode’s coverage is simple. First, your tests need to be using
XCTest (rather than the older SenTest OCUnit). Then edit your Xcode scheme’s
Test action. Check the Gather coverage data checkbox:

Run your tests. Then visit the Report Navigator, click on your test run, and
choose “Coverage” in the main panel:

Xcode shows you a summary for each file in your project. Hover over a bar to
see the percentage of code covered by your tests. (If you’d like to see a
numerical value without hovering, please dupe rdar://21531774). You can
expand a file’s disclosure triangle to see a coverage summary for individual
methods in that source file:

This function summary shows that the clef event coverage is spotty—one
method had all of its lines covered, two more had partial coverage and a
fourth method was never called. Double-click on a function to display the
source along with the coverage information in a gutter on the right-hand
side of the window. You can turn this information on and off via settings in
the Editor -> Code Coverage menu.
Covered line counts and percentages are pretty cool, but what can you do
with this information?
You can use the uncovered lines of code as a prod to write more tests,
creating scenarios to exercise those particular code paths. Your team might
decide on a target percentage of coverage. Checking in new code that drops
the coverage below that target results in public shaming and peer pressure to
add tests to cover the new features. How much coverage to strive for is
dictated by your available engineering time, the size and complexity of the
project, and the breakdown of testable data manipulation vs. much less testable user interaction, graphics and animation code.
There are diminishing returns as you approach 100% coverage. In most cases,
you won’t be able to achieve complete coverage because of “bail out because
everything is fundamentally messed up” code that may be impossible to trigger
without adding some kind of backdoor just to increase your coverage numbers.
As with anything measurable, organizations need to be diligent so that the
measured value doesn’t get gamed by clever engineers.
iOS test code has to be run in the context of an app, whether on the device or on the simulator. You may get noise as your app cranks up the user interface: “my FrobnitzView is drawing, resulting in 17% coverage, but I really don’t want it covered at all during this test.” You can prevent noise like this by gating the creation of the user interface based on whether you’re running in a testing mode or not.
An easy way to do that is to look for the existence of the test classes, which shouldn’t exist when you’re running the app normally during development. For example:
- (BOOL)application:(UIApplication *)application
    didFinishLaunchingWithOptions:(NSDictionary *)launchOptions {
    ...
    // bail out early if we're running as a test harness.
    if (NSClassFromString(@"XCTestCase")) return YES;

    // otherwise load the main storyboard.
    UIStoryboard *storyboard = [UIStoryboard storyboardWithName:@"MainStoryboard" bundle:nil];
    UIViewController *vc = [storyboard instantiateInitialViewController];
    ...
}
You can also create a compile time symbol and inspect it to decide whether to
start your user interface.
There are some other uses for code coverage information, such as a quick
sanity check of the code being tested. If your tests create and manipulate
15 objects, and then you notice that a method is called 300,000 times,
you may be doing too much work. If you have explicit lock and unlock methods
and the call counts aren’t identical, you might have unbalanced resource
locking.
Code coverage as a concept has
been around a long time, dating back to the early 1960s. Over the years, tools have provided coverage stats in different ways. You can give a flag to gcc or clang to have it emit code with
gcov instrumentation. You
run your program and it will drop data files into the file system. The gcov
command-line tool will then analyze those files and give you textual coverage
information. There are GUI tools, such as Cover
Story that show your coverage in
a more easily digestible format.
Xcode doesn’t use gcov, but instead uses newer coverage features provided by
LLVM. The code coverage mapping
format is documented.
Directly using LLVM’s coverage is similar to using gcov: supply the proper
command-line arguments to the compiler, and then run a tool to display the
results.
This GitHub gist demonstrates using LLVM’s coverage
tools. The compiler
gets two flags: one flag tells the compiler to generate instrumentation while
the other flag tells it to enable coverage mapping. Run the application. It
will drop a file of raw coverage information. Run the
llvm-profdata
command to massage the raw data into a form usable by other tools. Then run
llvm-cov to show
annotated source code.
The commands for Objective-C:
$ xcrun clang -g -Wall -Werror -fprofile-instr-generate -fcoverage-mapping -o testprof testprof.m
$ xcrun llvm-profdata merge -o testprof.profdata default.profraw
$ xcrun llvm-cov show ./testprof -instr-profile=testprof.profdata testprof.m
Here’s the compiler command for Swift (the last two commands are the same):
$ xcrun swiftc -profile-generate -profile-coverage-mapping testprof.swift
$ xcrun llvm-profdata merge -o testprof.profdata default.profraw
$ xcrun llvm-cov show ./testprof -instr-profile=testprof.profdata testprof.m
This is the output from llvm-cov for the Swift version of the coverage
sample program. The left-hand column is the line execution count, and the
second column is the source file line number. Lines without a line execution
count don’t have any correlation to the object code generated by the compiler.
(I don’t know why line 26, the function that drives the other two functions,
doesn’t report any coverage.)
       |    1|// xcrun swiftc -profile-generate -profile-coverage-mapping testprof.swift
       |    2|// testprof
       |    3|// xcrun llvm-profdata merge -o testprof.profdata default.profraw
       |    4|// xcrun llvm-cov show ./testprof -instr-profile=testprof.profdata testprof.swift
       |    5|
      1|    6|func DoSomething (value: Int) -> Int {
      1|    7|    if value == 55 {
      1|    8|        print ("got 55n")
      0|    9|    } else {
      0|   10|        print ("got something elsen")
      0|   11|    }
      1|   12|
      1|   13|    return 23;
      1|   14|}
       |   15|
      1|   16|func DoSomethingElse (value: Int) -> Void {
      1|   17|     let blah = DoSomething (value)
      1|   18|
      1|   19|     if blah == 23 {
      1|   20|         print ("yay 23")
      0|   21|     } else {
      0|   22|         print ("bummer")
      0|   23|     }
      1|   24|}
       |   25|
       |   26|DoSomethingElse(55)
Like any new tool, there are growing pains. As of Xcode 7 Beta 2, coverage
isn’t supported for UI testing yet (rdar://20966994). You might not get any
coverage results for existing projects (rdar://21359449, dupe of
rdar://21166772). Make sure you’ve turned on coverage in your scheme’s Test
action and that you’re using XCTest. Then work through the usual Litany of
Things To Try when Xcode Misbehaves: clean the build folder, restart Xcode,
reboot your device if there’s one involved, reboot your computer, install the
Xcode command-line tools, re-install Xcode or recreate your Xcode project
from scratch.
One of my larger projects did not work the first several times I attempted to get
coverage results, and I’m not sure which of the Litany of Things To Try
actually fixed the issue. If this happens to you, please file a
radar, include your project and mention radars
21359449 and 21166772.
Also, it seems like the coverage overlays use an exponential algorithm, so
coverage information in large source files (over several thousand lines of
code) could result in slow scrolling and the appearances of the OS X busy
cursor (rdar://21506221).
Code coverage is a useful tool to keep in your development arsenal. It can be
incredibly helpful when you’re writing tests for code that already exists—you’ll know which parts of the code aren’t being tested, and which parts are. It’s useful when you’re writing tests for new code to make sure you’re exercising everything. You could get this information prior to Xcode 7, but
it’s very nice having this information in Xcode directly now.
Our introductory guide to Swift Regex. Learn regular expressions in Swift including RegexBuilder examples and strongly-typed captures.
The Combine framework in Swift is a powerful declarative API for the asynchronous processing of values over time. It takes full advantage of Swift...
SwiftUI has changed a great many things about how developers create applications for iOS, and not just in the way we lay out our...