

Swift Regex Deep Dive
iOS MacOur introductory guide to Swift Regex. Learn regular expressions in Swift including RegexBuilder examples and strongly-typed captures.
So. That Clash of the Coders Thing. Kind of nice being able to flex mental muscles over a 72-hour sleep-deprived Dr Pepper-infused period of time, performing acts of violence upon the Objective-C runtime, UIApplication, and the layer stack. It was a blast being able to use all my platform knowledge with the express purpose of subverting it.
I was chatting with one of my Ranch cohorts the other day. He said, “Hey MarkD, how do I learn all those details? I feel like I’m kind of stuck in limbo land, just using tableviews and whatnot.” Talk about a daunting question. Especially coming from an engineer of considerable skill. “Uh, you just do stuff?” isn’t a good answer.
I’ve been programming professionally (that is, actually making a living at it) for 23 years now. That’s longer than some of my coworkers have been alive. That’s a scary thought. Get off my lawn. Over the years I’ve fallen into a style of learning and exploration that’s paid some pretty good dividends. Of course, everyone is different, but here’s how I would answer his question.
Read a lot. Throw information at your brain. There are a lot of books and blogs out there, especially compared to the old days when all of the Mac programming books would fit on a single shelf in a small IKEA bookcase. My favorite book of the moment is Rob Napier and Mugunth Kumar’s iOS 6: Pushing The Limits. I also must pimp Advanced Mac OS X Programming : The Big Nerd Ranch Guide because it digs into some of the lower-level details of OS X, many of which apply to iOS too. Don’t forget Amit Singh’s massive OS X Internals book) (The ebook version will make your Kindle heavier). Some parts are out of date, but it’s fascinating the kinds of details a real-live operating system kernel takes care of.
We live in a wealth of information online was well. In addition to this humble weblog, you should be reading Mike Ash’s NSBlog. I also regularly read NSHipster and fellow rancher Jeremy W. Sherman’s blog.
Don’t forget to read the official documentation. Browse the Cocoa / UIKit docs in Xcode. I have DocSets on my iPad so I can skim stuff while I’m waiting for something. Don’t limit yourself to the classes that you use all the time. Spend all your time in NSTableView? Give IOService a read. You’ll probably never use it, but maybe you’ll find some topic that’ll inspire further learning.
I try to read through the compiler and debugger docs on a regular basis. gdb is well documented. gdb is still relevant these days – lldb is still somewhat unreliable running on a device. The lldb website has some supporting documentation, so check its built-in help to learn all the available commands. Be sure to read all the things. If you see an esoteric feature, try to figure out why it exists.
The lowdown on the compiler can be found at http://clang.llvm.org. Don’t forget the header files too. There’s lots of useful information are buried in them.
I don’t remember everything. I don’t remember most anything these days. But I do retain shadows of “I think I read something like this before. Now where was it.” and a little cogitation reminds me “oh yeah, Jeremy blogged about his reimplementation of all of Cocoa in 12 lines of code, and he had a cool higher-order-messaging category that might turn out to be useful.”
To learn how things work, I like to see how things work. Knowing who-calls-whom can be illuminating. “Who is creating this undo manager?” was the key to solving a program bug. Maybe seeing the notifications that fly around an app can help you discover what MPMusicPlayerController is doing when it moves from song to song in a playlist.
We have a lot of really powerful tools to peek into our programs and libraries. You probably won’t use every one of them every day. Some you might only use once a month or once a quarter, but they’re good to have in your utility belt.
The source: The source to clang and lldb are easily obtained, so you can download them and build them. Have a question about how something works in the language? Poke around the source and see if you can find it. You can also get a decent subset of the Core Foundation source (amongst a lot of other stuff) at http://www.opensource.apple.com. The really interesting parts are “xnu”- the kernel, “CF” – Core Foundation, and objc – the objective-C runtime. Also, dig through the Cocoa headers and find something you might not understand, like NSAssert. Then figure out what makes it work.
The debugger: You can place breakpoints on any visible symbol, whether it’s your own code where you have file and line information, or functions and methods inside of binary-only libraries. You can enter breakpoints directly in Xcode by adding a “symbolic breakpoint”. Here’s one I added that will break on a private method in UIApplication called _performMemoryWarning:
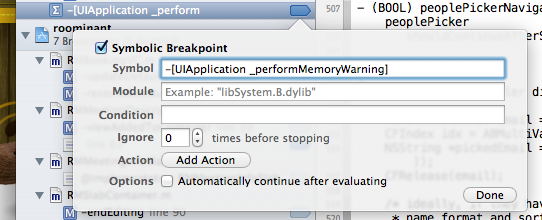
You can trigger a memory warning in the simulator and see that it gets handled:
Notification spying: Notifications are a common way of decoupling code. Something interesting happens and a notification gets posted. NSNotificationCenter and friends are so convenient that pretty much everything uses it. You can add a notification spy to print out all notifications that float by.
DTrace: I know folks wish I’d stop talking about DTrace. How did I find that _performMemoryWarning symbol? It’s obviously not in any of Apple’s documentation, with that leading underscore being the giant “this is Private API” hands-off flag. I DTraced a program in the simulator, triggered a memory warning, and saw what was happening. During Clash I wanted to answer some other questions too, like “where did UITouches get created and dispatched?” and “what actually hits the file system when loading a nib file?”. Thus was born a little utility script, spy.d (available at this gist).
spy.d is a simple script that traces Objective-C messages using the objc provider, ignoring messages on a list of common messages, and displaying full stack traces for methods on an “especially interesting” message list. I ran spy.d and triggered a memory warning in the simulator:
# ./spy.d  61271
...
UIApplication -didReceiveMemoryWarning
NSNotificationCenter +defaultCenter
NSNotificationCenter -postNotificationName:object:
...
UIImage(UIImageInternal) +_flushCache:
UIViewController +_traverseViewControllerHierarchyWithDelayedRelease:
UIViewController -didReceiveMemoryWarning
UIViewController -_traverseViewControllerHierarchyFromLevel:withBlock:
RMScheduleVC -didReceiveMemoryWarning
UIApplication gets the memory warning. It posts a notification. UIImage flushes its cache in response. Then UIViewController's class method walks the controller hierarchy and tells each one that it received a memory warning, and then it bubbles down to my code in RMScheduleVC.
class-dump: The Objective-C runtime is very rich in metadata. You can, at runtime, poke around classes and their methods and find all sorts of cool toys to play with. That information is actually stored in the application binary (and object files, and libraries), and can be extracted. Steve Nygard’s class-dump will extract this metadata and generate @interfaces for all the classes it finds. For example, from UIApplication:
...
- (void)_purgeSharedInstances;
- (void)setReceivesMemoryWarnings:(BOOL)arg1;
- (void)_receivedMemoryNotification;
- (void)didReceiveMemoryWarning;
- (void)_performMemoryWarning;
- (BOOL)_isHandlingMemoryWarning;
- (void)_processScriptEvent:(struct __GSEvent *)arg1;
- (void)_dumpScreenContents:(struct __GSEvent *)arg1;
- (void)_dumpUIHierarchy:(struct __GSEvent *)arg1;
- (void)setSystemVolumeHUDEnabled:(BOOL)arg1;
...
There’s all sorts of fun stuff going on. These are places you can put breakpoints and poke around the call stack. You can also dig into the implementation, too.
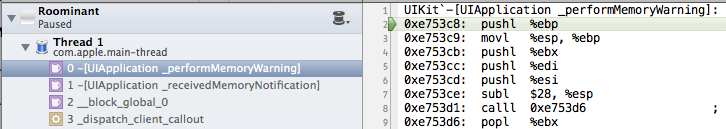
Hopper Disassembler: The Hopper Disassembler is a tool that reads object code and displays the corresponding assembly language. Here it is looking at UIKit, the method implementation of _performMemoryWarning on UIApplication:
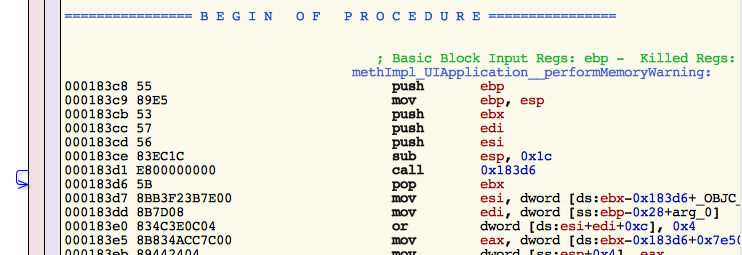 ?
?
What’s neat is Hopper can convert the assembly to pseudo code so you can better suss out the code flow.
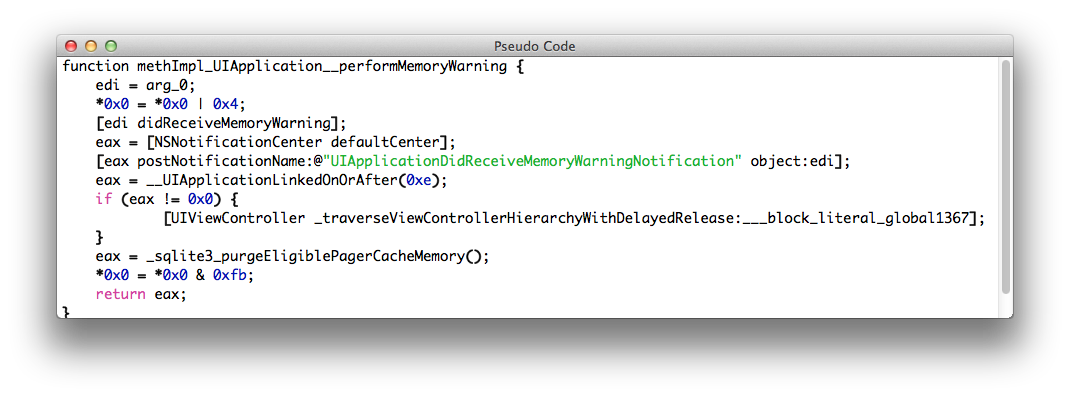
It’s also a neat way to learn an assembly language by example. Be warned you’ll be looking at code generated by a compiler, so it might not make a lot of sense at times when things get optimized.
Instruments: Instruments isn’t just for finding performance problems. It can be used to find locations in all the program’s code, both the code you wrote and the code from libraries, that you can start attacking with other tools. Wondering how UISlider does its live tracking? Point Instruments at an app with a slider, move it around for 10 seconds, and then see what’s at the top of the call stack. Then you can start applying DTrace in the simulator, or disassembling, and see what’s going on.
Just a quick warning – be very careful how you apply information you learn from these tools. They’re great for debugging and figuring out how things work. Relying on implementation details and private API in the stuff you ship can lead to fragile software that breaks with major or minor OS releases. If you’re shipping software to paying customers, or customers are using your software for non-trivial things, you are a professional programmer. Be sure to act like one.
Now that you have a fleet of tools, it’s time to learn stuff. I learn best by actually doing. Get dirty and make mistakes! Interested in learning UITableView in depth? Write a bunch of table view code. Browse the docs. Look at the header for API you might not have used before, and use it and see what happens. Read some blogs. Class-dump it and look for some intriguing private API and see if you can trigger it from the regular interface. DTrace it and see the flow of messages. Add the notification spy and see what the toolkit is trying to tell you. If something doesn’t work, apply your usual debugging techniques and figure out why it’s not working. See if you can re-implement it yourself.
I tend to play around in the world of code below UIKit / AppKit, so I write a lot of little programs that exercise some data structure or language feature. Steve Sparks, my partner in Clash Crime, has his Playgrounder, an Xcode project with tab views and navigation controllers where he can throw a new experiment in there at any time. Want to muck around with some UIScrollView violence? Toss in a new view controller, hook it up, and now you can play with it in the simulator or on a device. Keep it under source code control and you can have a record of all of your experiments.
You decided on something to learn. You’ve written a bunch of code. You’ve debugged. Maybe you’ve taken a lot of notes. Now it’s time to let it all digest. Sleep on it. Take a bike ride. Go take an hour-long shower. Let all the new stuff you’ve exposed yourself to settle into patterns. See if you can build abstractions from those patterns, and apply them to other classes. Much of software development these days can be mechanical – there’s a set of features that need to be implemented, and a usual set of classes you glue together.
This assimilation step is where the real fun starts happening as your brain starts building relationships. Many of the examples here came out of a simple question that came up while working on our Clash entry: “We want to trigger memory warnings in the app on-demand”, to help debug memory and caching problems. The investigation process went like this:
We can trigger memory warnings in the simulator
Use the notification spy to see if there’s notifications that fly by. Why yes there are. We can hook into that and respond to them.
Posting the notification didn’t actually trigger stuff. Bummer. I wonder why.
What methods are getting triggered? Use spy.d and see what’s happening. Oh look, _performMemoryWarning looks pretty interesting.
Are there other memory warning methods I might look at? Pull out class-dump and see what’s there.
Sending _performMemoryWarning to the current UIApplication instance seems to kick in all the memory warning machinery. Why didn’t posting the notification?
Just for fun, fire up Hopper and see what it’s actually doing. Oh look, it has that view controller hierarchy and sqlite thing, which don’t get hit just by posting the memory notification.
Add a memory warning trigger button to the debugging console, wrapped in an #if block to prevent it from getting released to the world.
And that’s pretty much my secret strategy to honing my nerdskills:
Read – Throw a lot of facts at the brain. Some may stick. I find that kind of stuff fun to read, so it’s an enjoyable pastime.
Dissect – Get comfortable with a wide range of tools, from high to low level, and don’t be afraid to use them. And don’t be afraid to use them in weird ways. DTrace can be a big hammer. But sometimes you can smash a bug into tiny little pieces with it. Use these tools to dig into software to see how it works. Promise you will use this knowledge for good, not evil.
Experiment – Write code. Write a lot of code. Experiment. Play with all the new found toys. Tease out the patterns.
Assimilate – Reflect. Lather, rinse, repeat. Then keep doing it for the next twenty years. Building deep skills is a long-term work in progress.
Our introductory guide to Swift Regex. Learn regular expressions in Swift including RegexBuilder examples and strongly-typed captures.
The Combine framework in Swift is a powerful declarative API for the asynchronous processing of values over time. It takes full advantage of Swift...
SwiftUI has changed a great many things about how developers create applications for iOS, and not just in the way we lay out our...